Using Trends
Classic Nakisa HR Suite allows you to analyze and filter your historical trends for Employees, Positions, Tenure, Span of Control, and Organization Layers. You can use these data to assess your progress towards long-term objectives, to give you better insight into current conditions, and help inform future plans and development.
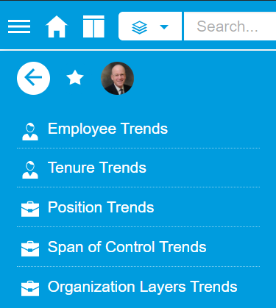
To access the Trends page
Click the Main Menu  and select Trends, then select Employee Trends, Position Trends, or Org Unit Trends, as appropriate.
To open a new Trend chart
Click the Available Charts icon  and select the chart you want to open.'
To extract the list of filtered results from the Trend chart
- Select the filters you want to apply to your data from the filter panel on the left.
- Click Search
 in the list of Trend menu icons to open a new tab with the list of employees or positions who meet the criteria you filtered on. If you need to remove filters from your list, click the x on the icon representing the specific filter to close it.
To share your Trends:
- Configure your Trends page to your specifications.
- Click Share
 .
. - Click Copy to Clipboard and Close.
- Share the link with the appropriate users as needed.
To save your Trends configuration as a Favorite
- Configure your Trends layout, modes, dates, and filters to your specifications.
- Click Add to Favorites
 .
. - Enter a name for your Trend layout and click Save.
To access this layout again, click the Main menu, and select Favorites  . Open the menu under Dashboards and select the layout you saved.
To change the Chart Mode
You can change how the chart displays, depending on the items selected in the Filter Panel. There are four modes available:
- Normal: This displays the overall trend for the entire node
- Absolute: This displays the graph for the entire trend and the trend for the selected filters, with the scale set at the same range for both metrics
- Relative: This displays the trend for the entire node and the trend for the selected filters, with the scale set at a relative range for each metrics
- Percentage: This displays the trend for the entire node and the trend for the selected filters, with the scale set at the absolute range for the entire node, and a percentage scale for the selected filters
- Open the appropriate Trend graph.
- Select the filters needed in the Filter panel.
- Click the Modes Menu
 and select the mode you want to use.
To Save Your Trends Settings
Click Save  . This will save your settings into your browser, and when you re-open the Trends tab, the Trends tab will open with your selected filters and chart layouts.
To filter the data that appear on the Trend charts
Select the appropriate filters in the Filter Panel and the chart will update accordingly.
To Change the Date Range for Trends
Move the date slider to the selected date range, then click Change Date  .
.
Working with Trends Charts
- To show the selected chart compared against a variance between the most previous and current effective dates, click Variance
 . This will provide your users with an overview of their headcount trends with percentages and variance to compare against your company goals and targets.
 - To show a selected chart compared against another chart (showing multiple operations/concepts at the same time), click Compare
 and select the second comparison chart. Both charts will appear with the same X and Y axis,
 - To select the category to display within a chart, click Available Categories
 .
. - To toggle between a graph and a table, click the Table
 icon or the Graph
  icon, as appropriate.
 - To toggle between a bar chart and line chart, click the Bar Chart
 or Line Chart , as appropriate.
 - To open additional operations/views for some charts, click the Operations icon
 to access additional display options for the chart.
Note: If you are using Effective Dates in your environment, your Classic Nakisa HR Suite administrator will have set up automatic indexing of all of your effective dated data. (Out of the box, this is set to be done once a quarter, but your administrator may have changed that.) While this full indexing is taking place, the Trends analytics will show a value of 0. After the indexing process completes, the Trends values will calculate and display correctly in Classic Nakisa HR Suite.

|
Classic Nakisa HR Suite 2022.R2-SP1 © 2023
|
Nakisa Inc. All rights reserved worldwide. |