Employee Analytics: Workforce & Management Metrics
This topic covers employee analytics for workforce and management metrics that are available in:
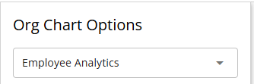
- Position Reporting Structure: Employee Analytics view in Org Chart Options.
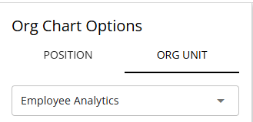
- Org Unit Reporting Structure: Employee Analytics view for Org Units in Org Chart Options.
For all available analytics:
- Only Active employees are included.
Note: An inactive employee is someone who is not currently working, such as those on leave or who have retired based on the employee status data. The specific definition may vary depending on each customer's data criteria.
- Analytics reflect the Legal reporting structure
- Results depend on whether you are viewing a Position Reporting Structure or an Org Unit Reporting Structure.
- In Position Reporting Structure views, Headcount and employee‑based metrics exclude the selected position holder. On the other hand, in Org Unit Reporting Structure views, these metrics include the selected org unit holder (employees are counted based on org unit assignment, not role).
Headcount
| Position Reporting Structure | Org Unit Reporting Structure | |
|---|---|---|
|
Represents |
The total number of employees reporting under the selected position. |
The total number of employees reporting under the selected position. |
|
Included |
Employees who report directly or indirectly to the selected position. |
Employees directly assigned to the org unit, and employees in child org units under it. |
|
Excluded |
The position holder themself, inactive employees, and employees outside the reporting line. |
Employees assigned to other org units, inactive employees, and managers outside the org unit. |
Note: Unlike Position Reporting Structure, there is no concept of “excluding the manager themself” in Org Unit Reporting Structures.
Example (Position Reporting Structure)
You are viewing the Chief Executive Officer position.
The CEO has:
- 7 direct report positions
- A total of 82,888 employees reporting across all levels below
Included: all 82,888 employees under those reporting lines
Excluded: the CEO themself
Headcount = 82,888
This explains why Headcount ≠ Manager Count + 1. The manager is not counted as their own employee.
Employee FTE
| Position Reporting Structure | Org Unit Reporting Structure | |
|---|---|---|
|
Represents |
The total workforce capacity under the selected position, expressed as full‑time equivalents. |
The total number of employees reporting under the selected position. |
|
Included |
The FTE value of each employee reporting under the node (e.g. 1.0, 0.5), including part-time and shared employees. |
FTE values of all employees assigned to the org unit and its sub-units, including part-time and shared employees. |
|
Excluded |
The position holder themself, inactive employees. |
Employees assigned to other org units, inactive employees. |
Example (Position Reporting Structure)
Under a VP role, employees include:
- 10,000 employees at 1.0 FTE
- 2,000 employees at 0.5 FTE
Calculation: (10,000 × 1.0) + (2,000 × 0.5) = 11,000 FTE
Example (Org Unit Reporting Structure)
- Corporate: 86.4 FTE
- Finance: 184.8 FTE
- Manufacturing: 1,090.2 FTE
- Public Relations: 69.7 FTE
Calculation: 86.4 + 184.8 + 1,090.2 + 69.7 = 1,431.1
Span of Control
| Position Reporting Structure | Org Unit Reporting Structure | |
|---|---|---|
|
Represents |
The number of employees who report directly to the selected position. |
The total number of employees within the current org unit. |
|
Included |
Employees whose manager is this exact position. |
Managers of direct subordinate org units within the current org unit. |
|
Excluded |
Indirect reports, dotted‑line reports, inactive employees, and the position holder themself. |
Managers of the current org unit, and inactive employees. If an employee belongs to the current org unit and is also the manager of a subordinate org unit, they are only counted once. |
Note: This analytic represents a direct span, not an average.
Example (Position Reporting Structure)
A Vice President has:
- 7 managers reporting directly
- Each of those managers has their own teams
Only direct reports are counted:
Span of Control = 7
Example (Org Unit Reporting Structure)
Corporate org unit has 7 employees with at least one direct report.
Span of Control = 7
Average Span of Control
| Position Reporting Structure | |
|---|---|
|
Represents |
The average number of employees per manager across the entire reporting structure under the selected node. |
|
Purpose |
To help analyze organizational balance and management efficiency. |
|
Calculation |
Average Span of Control = Total employee headcount ÷ (Total number of managers + incumbents) |
Example
Under the CEO:
- Total headcount (excluding CEO): 82,888
- Managers + incumbents: 26,885
Calculation: 82,888 ÷ 26,885 ≈ 3.1
Note: This is why Span of Control (7) and Average Span of Control (3.1) can both appear. They answer different questions.
Manager Count
| Position Reporting Structure | Org Unit Reporting Structure | |
|---|---|---|
|
Represents |
The number of employees under the selected position who have at least one direct report. |
The total number of employees in the org unit who manage at least one other employee. Note: Manager Count and Span of Control often show the same value, because both are counting managers, not team size. |
|
Included |
All active managers below the position (direct and indirect). |
All active managers in the org unit and sub‑units |
|
Excluded |
Individual contributors and inactive employees. |
Individual contributors and inactive employees. |
Example
CEO organization includes:
- 26,885 employees who manage at least one person
Manager Count = 26,885
Manager to Individual Contributor %
| Position Reporting Structure | Org Unit Reporting Structure | |
|---|---|---|
|
Represents |
The proportion of managers compared to individual contributors in the reporting structure. Helps identify management‑heavy or IC‑heavy structures. |
The proportion of managers compared to individual contributors within the org unit. |
|
Included |
Active employees under the selected position who are classified as managers (employees with at least one direct report) and individual contributors. |
Managers and individual contributors within the org unit and all sub‑units |
|
Excluded |
The selected position holder, inactive employees, dotted-line reports, and employees outside the reporting line. |
Inactive employees and employees outside the org unit |
|
Calculation |
(Managers + incumbents) ÷ Individual contributors x 100 |
(Number of managers ÷ Number of individual contributors) × 100 |
Example (Position Reporting Structure)
- Managers + incumbents: 26,885
- Individual contributors: 56,003
Calculation: (26,885 ÷ 56,003) × 100 ≈ 48.0%
Example (Org Unit Reporting Structure)
- Managers in Corporate: 7
- Individual contributors: 51
Calculation: (7 ÷ 51) × 100 ≈ 13.7%
Average Tenure
| Position Reporting Structure | Org Unit Reporting Structure | |
|---|---|---|
|
Represents |
The average length of time employees under the node have been employed. |
The average length of time employees in the org unit have worked for the organisation. |
|
Included |
Active employees under the position only. |
Active employees in the org unit and sub-units |
|
Excluded |
The position holder themself and inactive employees. |
Inactive employees. |
Example (Position Reporting Structure)
- Employees under CTO have tenures ranging from 0.5 to 10 years
- The calculated average is 1.7 years
Example (Org Unit Reporting Structure)
The Corporate org unit includes employees across multiple sub-units, ranging from recently hired staff to long-tenured leaders.
- Employee tenures range from 1 year to 20 years
- Calculated average tenure is 11.4 years
Average Age
| Position Reporting Structure | Org Unit Reporting Structure | |
|---|---|---|
|
Represents |
The average age of employees under the selected position. |
The average age of employees assigned to the org unit and sub-units. |
|
Included |
Active employees under the position only. |
Active employees in the org unit and sub-units |
|
Excluded |
The position holder themself and inactive employees. |
Inactive employees. |
Example (Position Reporting Structure)
Employees under the CEO average 41.8 years
Example (Org Unit Reporting Structure)
Average age across Corporate org unit = 45.6 years
Layer
| Position Reporting Structure | Org Unit Reporting Structure | |
|---|---|---|
|
Represents |
The level of the selected position within the organisational hierarchy. |
The org unit’s level within the organisational hierarchy. |
|
How to read it |
Lower numbers = closer to the top of the organisation. |
|
Example
- CEO → Layer 1
- VP → Layer 2
- Director → Layer 3
Depth
| Position Reporting Structure | Org Unit Reporting Structure | |
|---|---|---|
|
Represents |
How many reporting layers exist below the selected position. |
The number of organisational levels that exist below the selected org unit. |
|
Purpose |
Helps identify tall vs flat organisational structures. |
|
Example
Depth = 10 → There are 10 levels of management below this role

|
|
Nakisa Inc. All rights reserved worldwide. |