Set and Track Scenario Targets
Use targets and built-in analytics to track and evaluate the impact of your organizational changes. You can set specific performance thresholds—such as headcount or span of control—and monitor changes in real time to ensure your design meets strategic goals.
Best practices:
- Use targets early in your scenario to guide strategic design.
- Regularly refresh analytics to evaluate each change in real time.
- Use the Delta values to justify decisions during stakeholder reviews.
- Combine visual indicators and numerical thresholds for comprehensive insight.
Targets and analytics give you actionable visibility into how your organizational design decisions align with business goals. Use them to stay aligned, stay accountable, and make informed, measurable improvements.
Define a Scenario Target
- Log into the application and open your scenario.
- Navigate to the Org Chart tab.
- Right-click the position or org unit for which you want to set a target.
- From the context menu, select Set Target.
Select a Metric
- In the Target Metrics window, select a metric from the Analytic list.
Example: Span of Control
- Enter the Lower Bound and Upper Bound values for the selected metric.
Example: Lower Bound = 5, Upper Bound = 10
- Click Save.
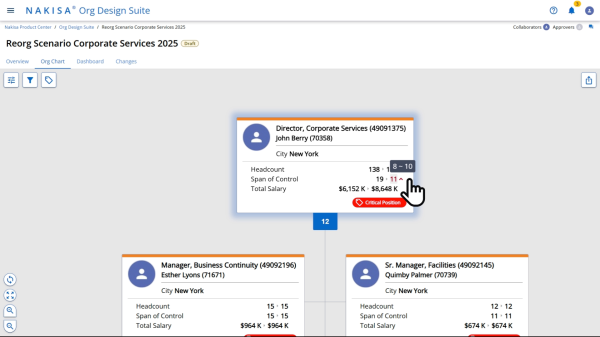
Once saved, an indicator icon will appear next to the org chart box to reflect its compliance status:
- A red upward arrow indicates the metric exceeds the upper limit.
- A green check mark appears when the metric is within range.
Restructure to Meet Targets
To adjust your structure to meet defined targets:
- Use multi-select to move multiple boxes:
- Hold the Control key and click each box individually, or
- Click and drag to select a group of positions or org units.
- Drag and drop the selected roles under a new or existing manager.
Example:
- Move all Project Manager roles under PMO Lead.
- Move all Business Analyst roles under Business Development Manager.
- After the move:
- Each updated position or org unit will display a Moved indicator in the top-right corner.
- The org chart will reflect the new reporting structure immediately.
Refresh and Analyze Impact
To review how structural changes affect your targets:
- Click the Refresh Analytics button from the top menu.
- In the analytics panel:
- Review the Delta Column to compare before and after values.
- Monitor metrics like Span of Control and Total Salary to evaluate progress.
Example insight:
- Before: John Berry’s span of control = 19
- After restructuring: Span of control = 11
- Result: The indicator shows the metric is closer to target, with significant improvement.
You can also monitor financial impact through updated Total Salary values, reflecting the budgetary implications of structural changes.
Reviewing all Scenario Targets
Targets can be established throughout the organization, but it can be challenging to gain a comprehensive view of how each department is performing against their goals.
The Tartet Summary tab lists all of the targets set for the scenario, and includes details about the department responsible for each target, the relevant analytics, and the current status of each target.
The visual indicators mirror those found in the organizational chart:
- Red chevron pointing up signifies that the current value exceeds the target.
- Blue chevron pointing down indicates it falls short of the target.
- Green checkmark shows that the current value meets the target.
To view all targets:
- Navigate to the Target Summary tab.
- To edit or delete a target, click
 in the Action column, which opens same Target Metrics window as the one from the org chart.
 - Modify the targets as required.
- To deleted a target, click
 .
. - Once you have completed your changes, click Save. The updated targets are reflected on the page.
- To navigate to the designated target in the org chart, click the view in org chart icon
 .
. - To navigate to the Details page, click the view details icon
 .
.

|
Nakisa Strategic Org Design 2026.R1 © 2026 |
Nakisa Inc. All rights reserved worldwide. |